OEE.Box - The smart way to
Transparent Production Lines!
Every minute of unused machine time costs money. The OEE.Box is the smart solution to use your machines more intelligently and increase the productivity of your production.
Our OEE.Box is a combination of the latest hardware and software for the digital recording of your machine and production data. With their help, you can optimize your production processes and make them more efficient in the long term! The OEE.Box is a BDE system that records downtimes, cycle losses, quantities and order times in order to calculate the degree of utilization, the degree of quality and the OEE of your production systems. Thanks to the OEE.Box, you always have an overview of your machine performance and system utilization so that you can quickly identify your sources of loss.
The integration of the OEE.Box into your existing IT landscape is simple and it adapts perfectly to your individual processes and requirements. This saves you manual data entry and the associated time and human resources. In addition, the OEE.Box enables real-time capacity and loss analysis.
Continuous Improvement Process (CIP)
The OEE.Box is an innovative system for monitoring and improving production efficiency based on the concept of Overall Equipment Effectiveness (OEE). The system continuously collects data on the availability, performance and quality of your equipment and presents it in real time. By identifying bottlenecks and potential problems, you can optimize your production and increase profitability.
The OEE.Box data enables you to implement automated continuous improvement processes (CIP) in your production. The OEE.Box automatically provides you with data and reports that help you to identify and prioritize potential for improvement. With the help of the OEE.Box you can make your CIP processes more effective and efficient and achieve results faster. Our OEE.Box is a flexible solution that can be adapted to the specific requirements of your production.
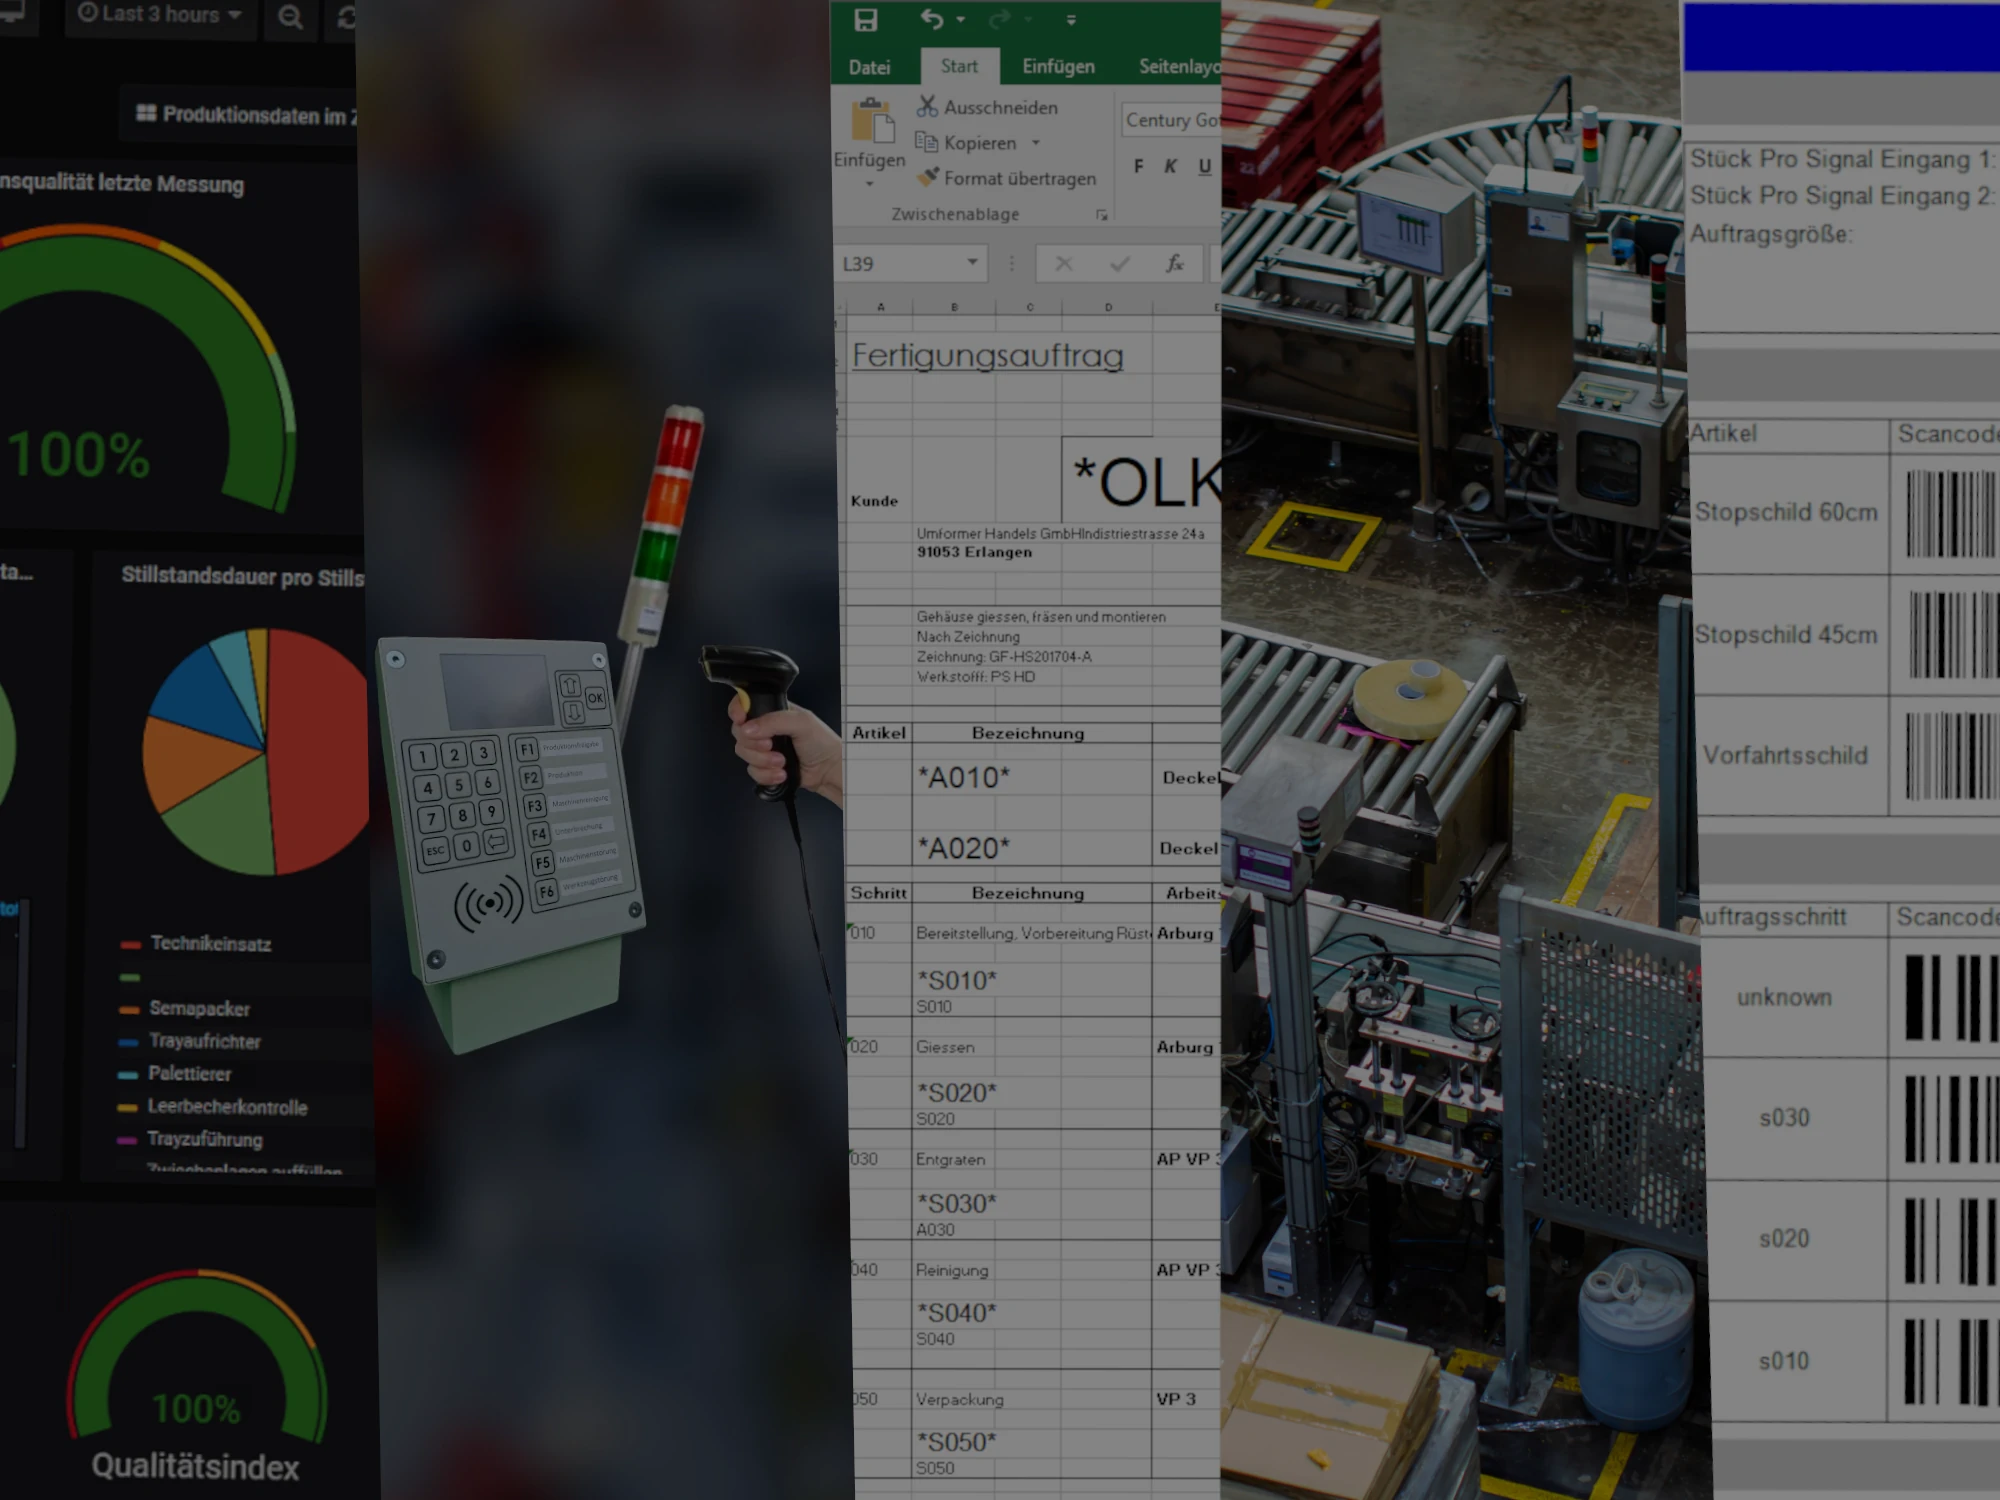
The OEE.Box consists of
1.Software
- The OEE-Box provides a web interface for real-time monitoring of machine status, reading downtimes and checking production line efficiency
- With the report and discovery tool, evaluations can be created, e.g. Monthly reports, job management and analysis, downtime review and more
- The tool also enables the creation of scannable barcodes for shutdowns or orders
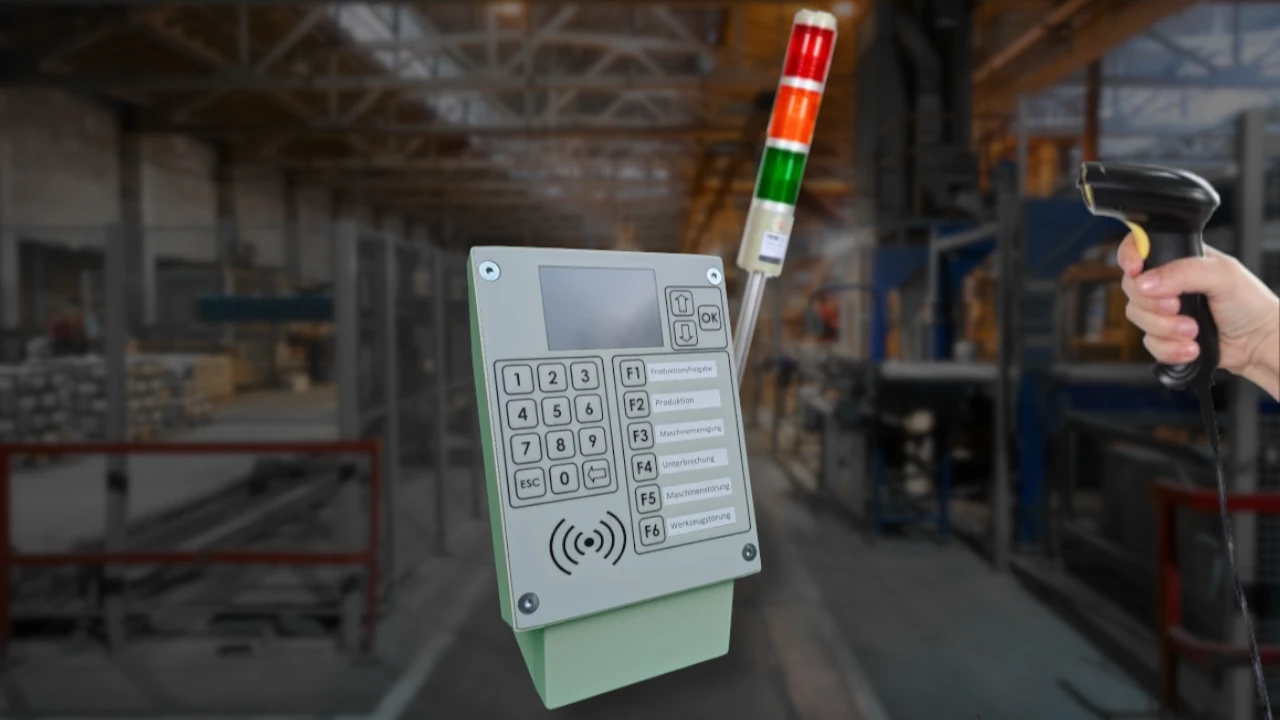
2. Traffic Light & Barcode Scanner
- Traffic light shows the status of production lines, reacts to the cycles of the machines
- If there is no cycle for a predefined time, the traffic light changes from green to red
- Employees deposit reason for downtime by scanning downtime code > traffic light changes to red-yellow
- When the production continues, the traffic light turns green again
- Individual barcodes for a production line and self-definable downtimes are possible

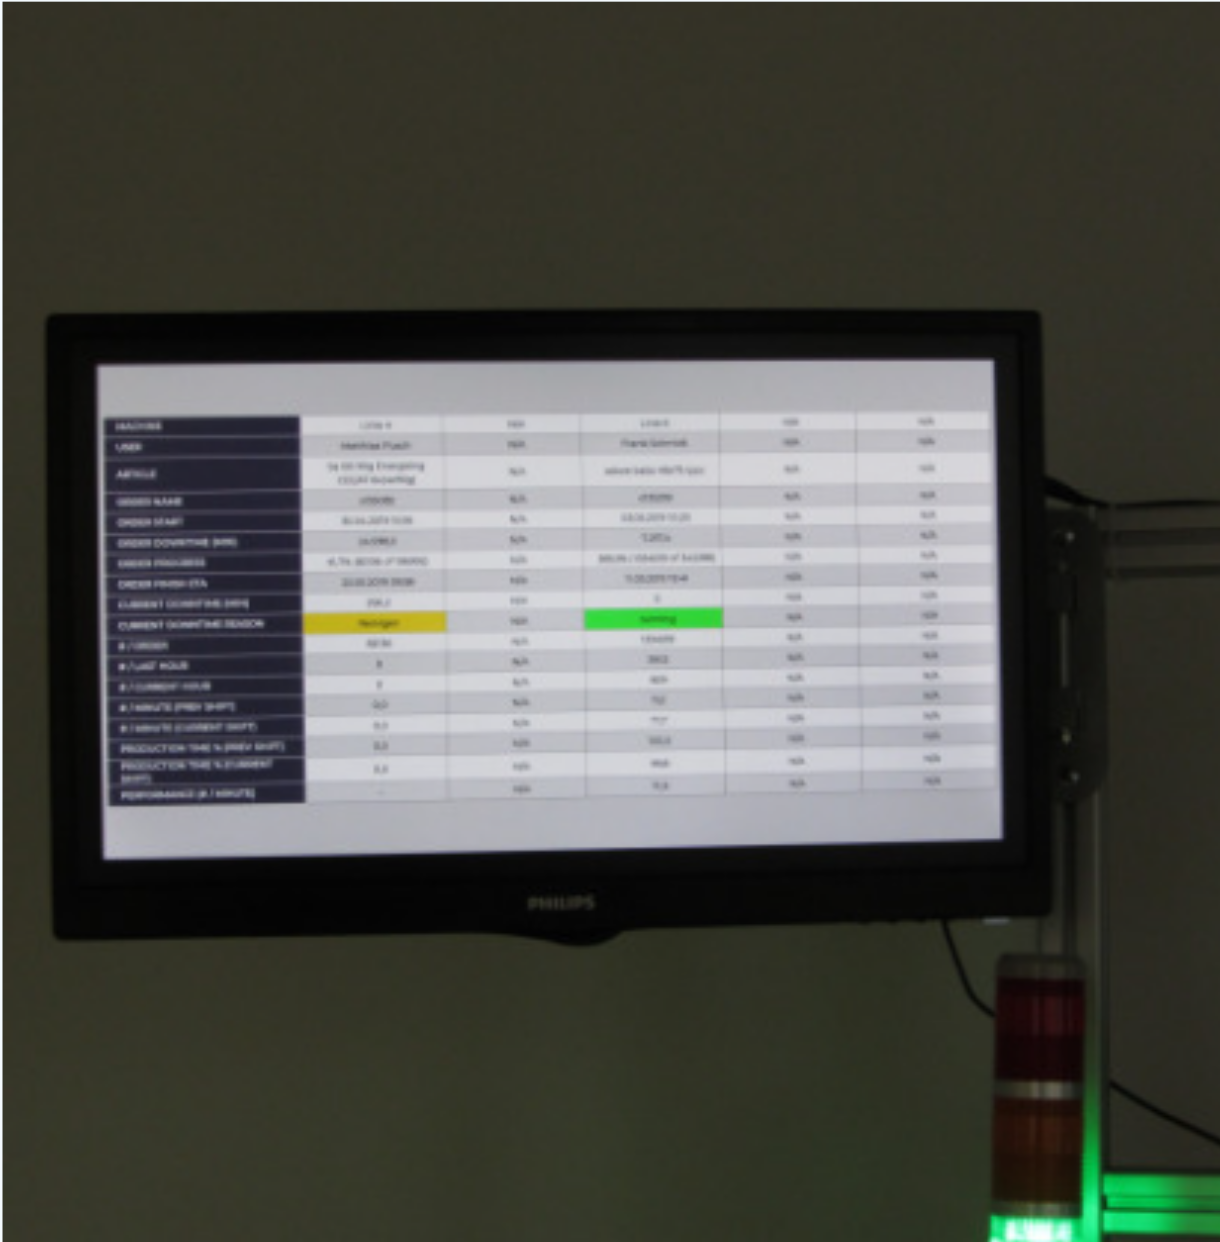
3. Hall monitor
- Key figures of the production line can be read directly at the production site
- Any monitor or TV can be used
- OEE.Box is mounted behind the monitors
- Monitors are connected to the OEE.Box via HDMI
- Display options: Current personnel at the machine, currently produced items, current order, reasons for downtime, detailed time to complete the order, performance metrics and more
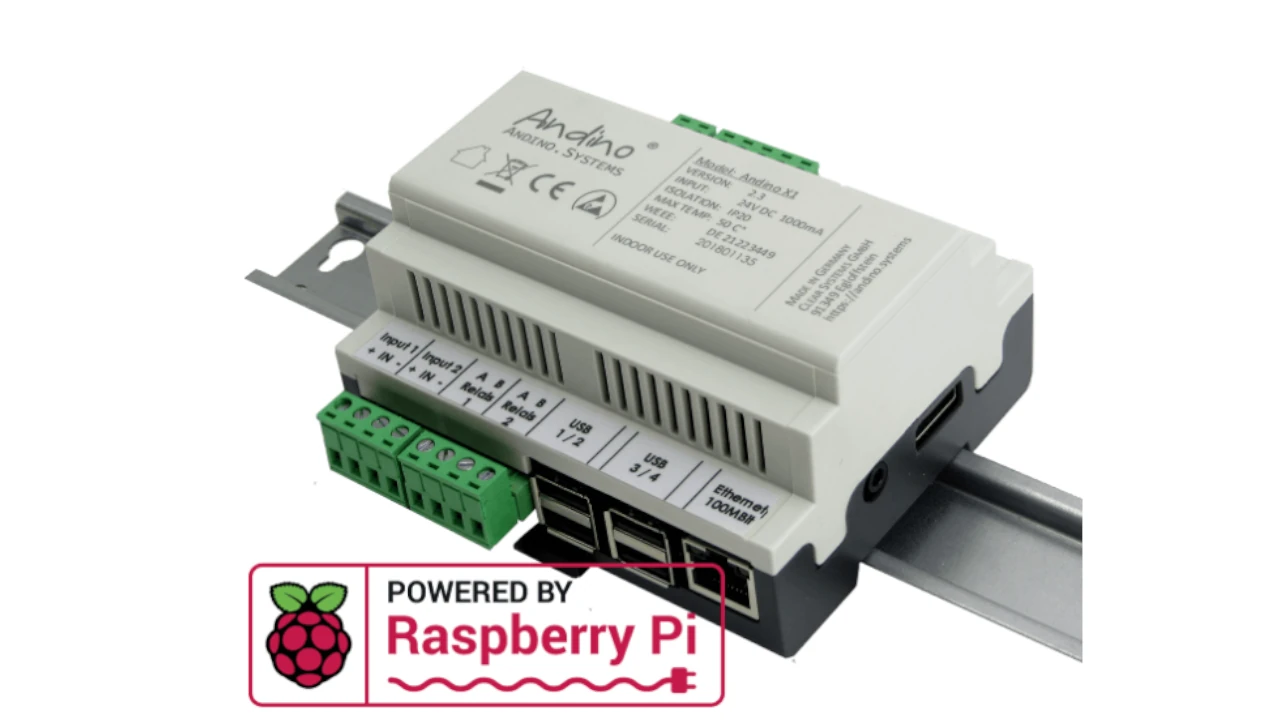
4. Andino X1
- Andino X1 is a small industrial PC developed by us
- forms the heart of the OEE.Box and is connected to a clock output of your machine with a wire
- This enables uniform data acquisition - even in a heterogeneous machine environment
- EMC tests: DIN EN 55022, DIN EN 61000-4-2, DIN EN 61000-4-3 DIN EN 61000-4-4, DIN EN 61000-4-5, DIN EN 61000-4-6, DIN EN 61000 -4-8, RED
The OEE.Box Determines Your...
The reasons for downtime vary from machine to machine. Accordingly, the reasons can be defined individually. In addition, it can be stored whether the downtime is unplanned, planned or planned non-production time.
In addition, it can be specified whether the standstill should be closed automatically with the next clock signal, which is not desired with the "setup" standstill, for example.
The downtime evaluations include:- Individual listing of downtimes with time, type and duration per order, day, shift, month.
- Total downtime per order, day, shift and broken down by planned/unplanned
- History of downtime per shift or day
Each machine has its ideal cycle time, depending on the item being produced. The clock time is obtained by dividing a period of time by the clock cycles. The fastest clock is usually the ideal clock.
If you compare the current and the ideal cycle time, you can see the clock losses.
The number of pieces produced can be determined from the cycles of the machine. A cycle is usually a quantity, but it is also possible that a cycle contains several quantities, e.g. if an injection mold has several cavities.
This setting can be individually adapted to the article. In the evaluations it is possible to determine the number of items per shift, per day or per order.
Incorrect quantities can also be assigned to the corresponding order, which is then deducted from the total number of pieces.
An order barcode is stored for each order. This is how the OEE.Box books the order in and out. For each order, it determines the respective running time on the corresponding machine.
This means that the runtimes can be assigned to the orders and billed to the minute.
The OEE.Box continuously measures the fastest and average cycle times and files them with the current order. Subsequently, based on the parts produced, the losses due to the deviation from the ideal cycle can be determined.
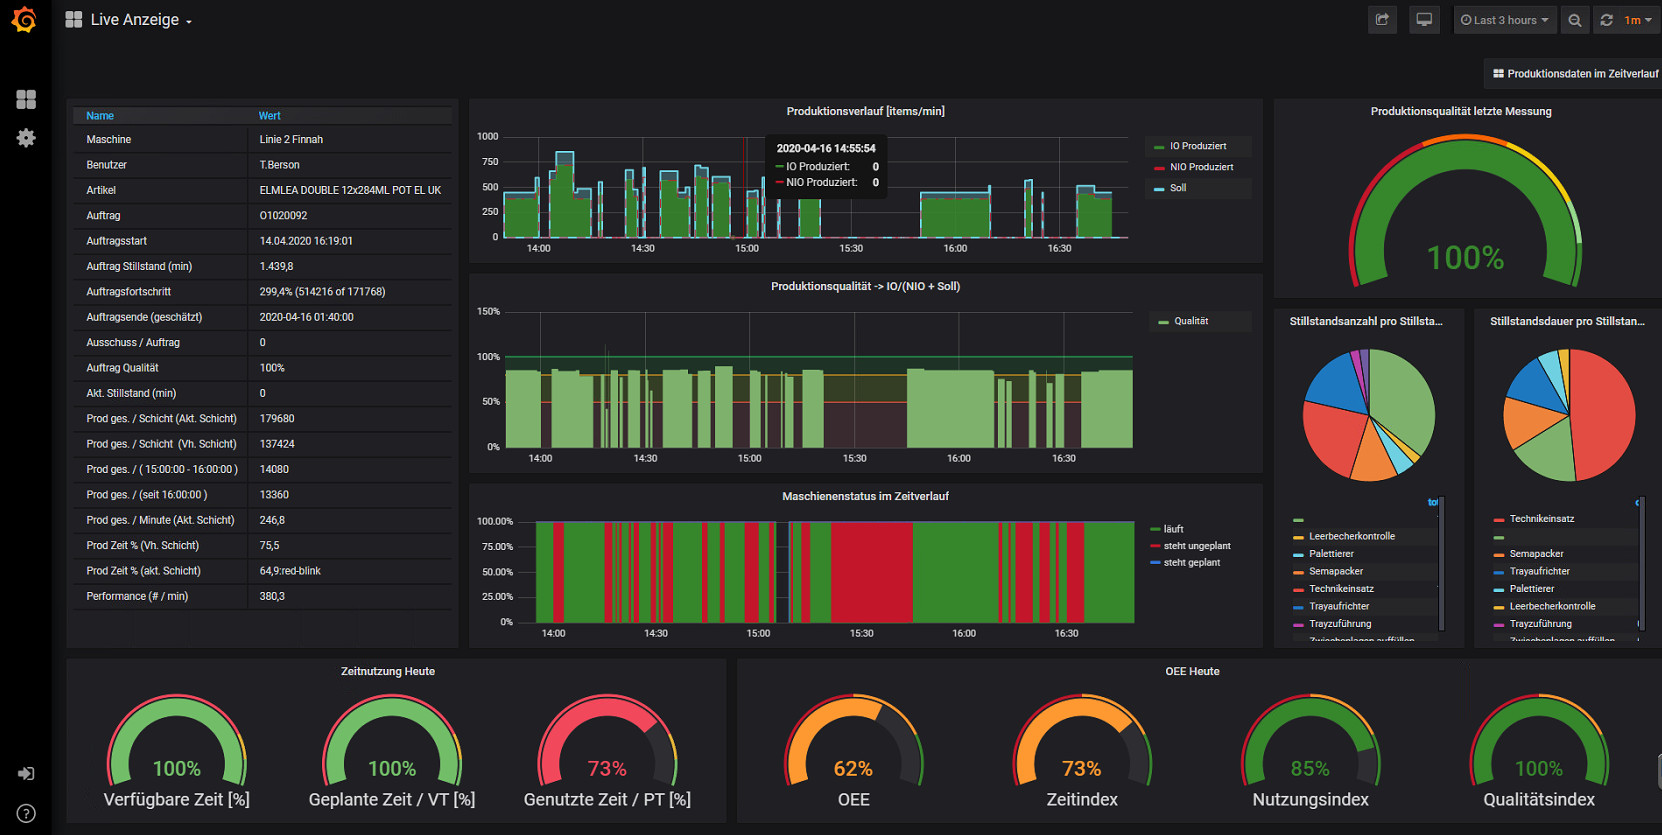
Overview of the Web Interface:
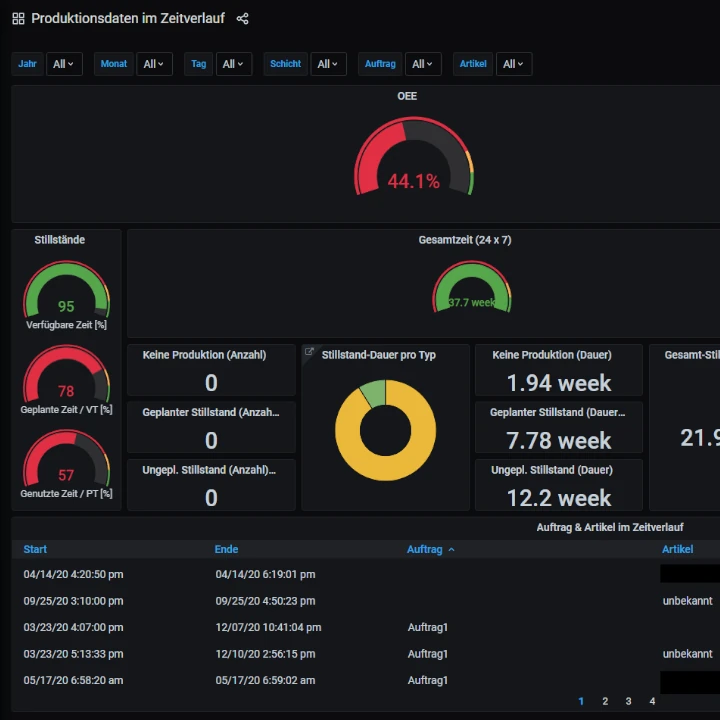
See all important characteristics of your production line at a glance on the web interface!
Check downtimes and reasons in an interactive interface!
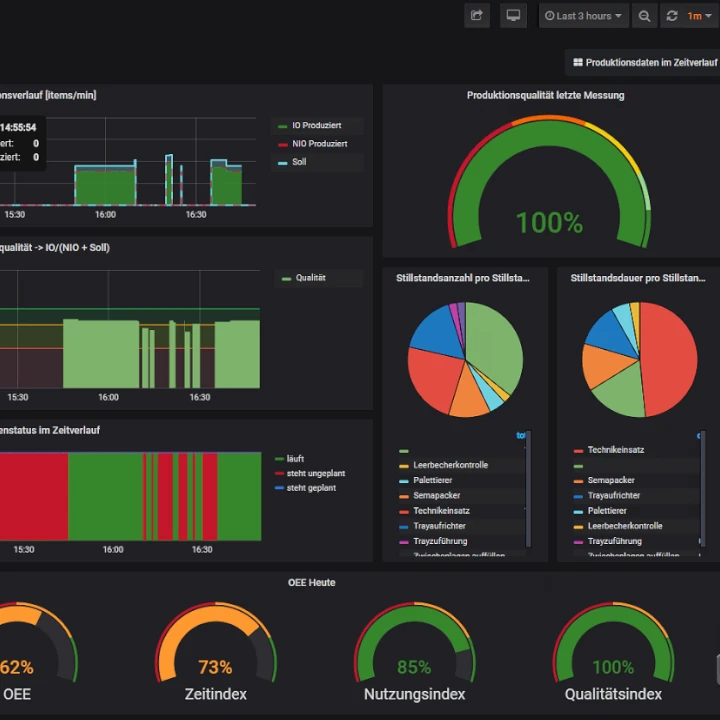
See the current status of your production line in real time!
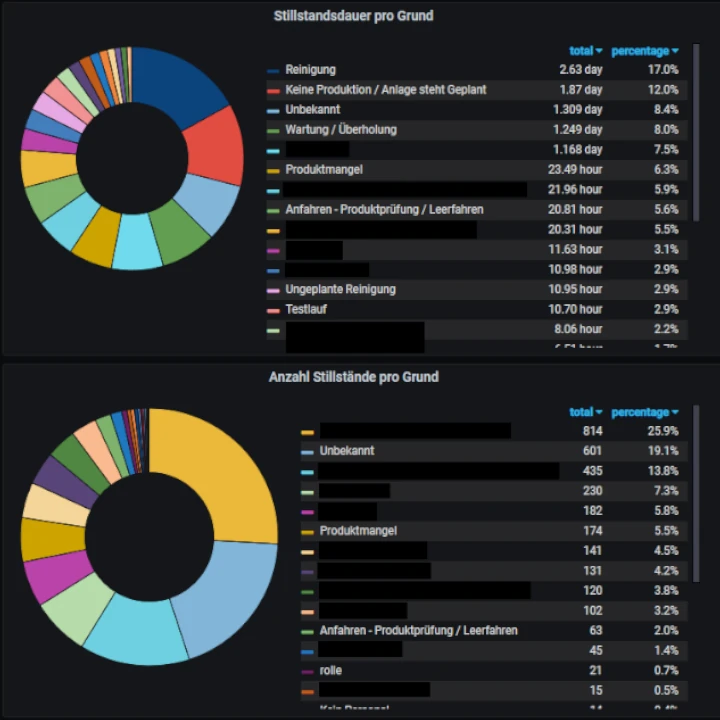
Evaluation of Standstills:
Keep an eye on when and why downtime occurs.
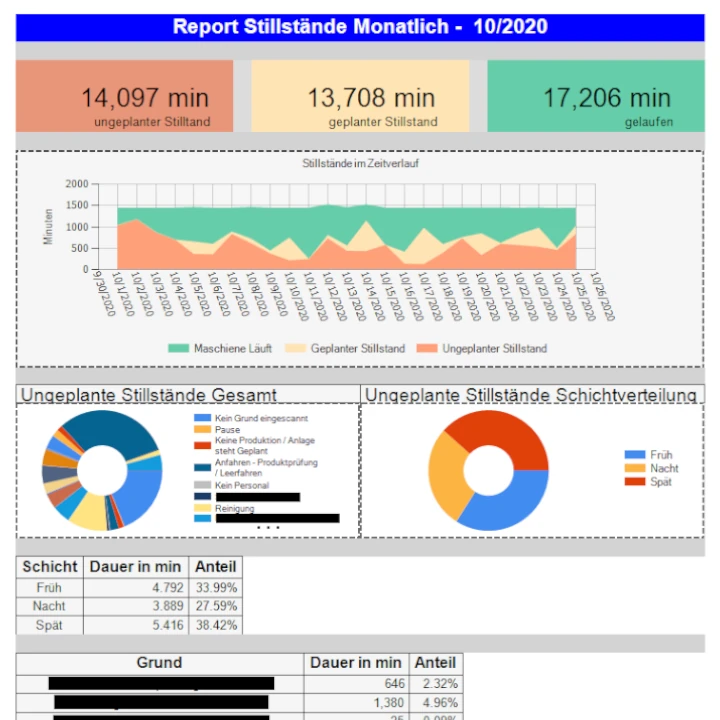
Create graphical evaluations of downtimes on your production line.
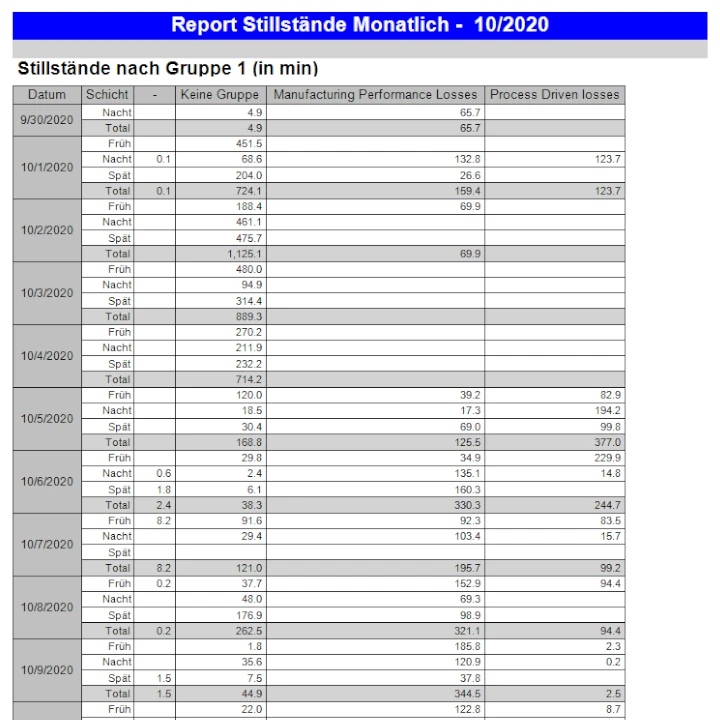
Order management and analysis
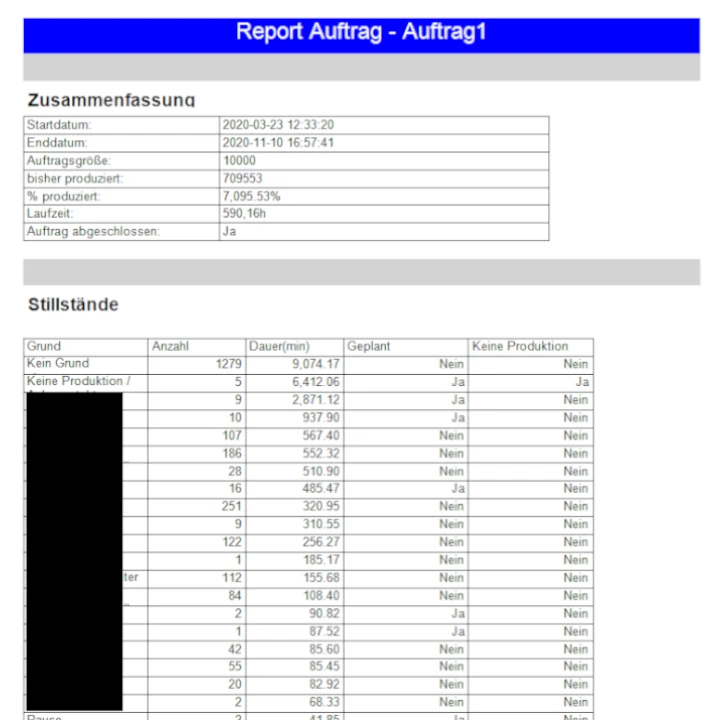
View detailed reports on production progress, quality and downtime for your individual jobs.
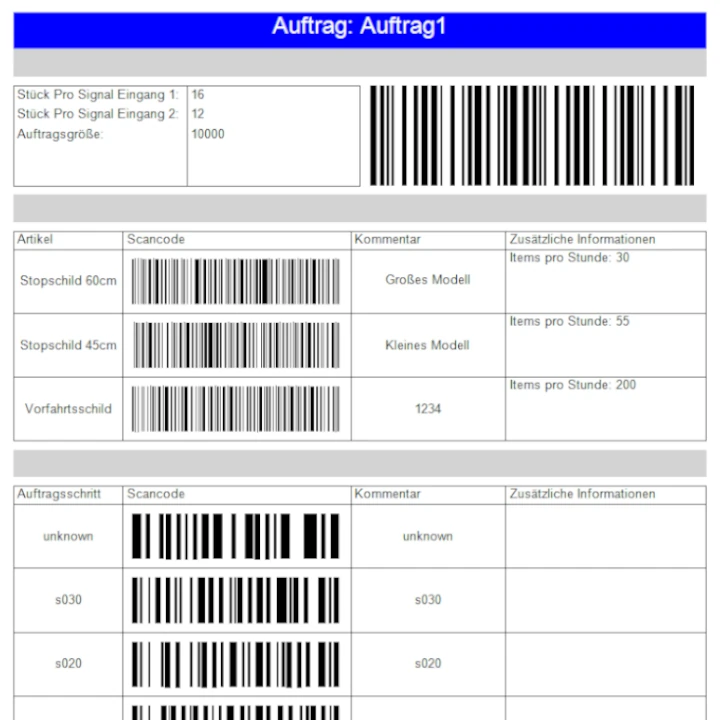
Create summary sheets with barcodes for the items included in a specific order.
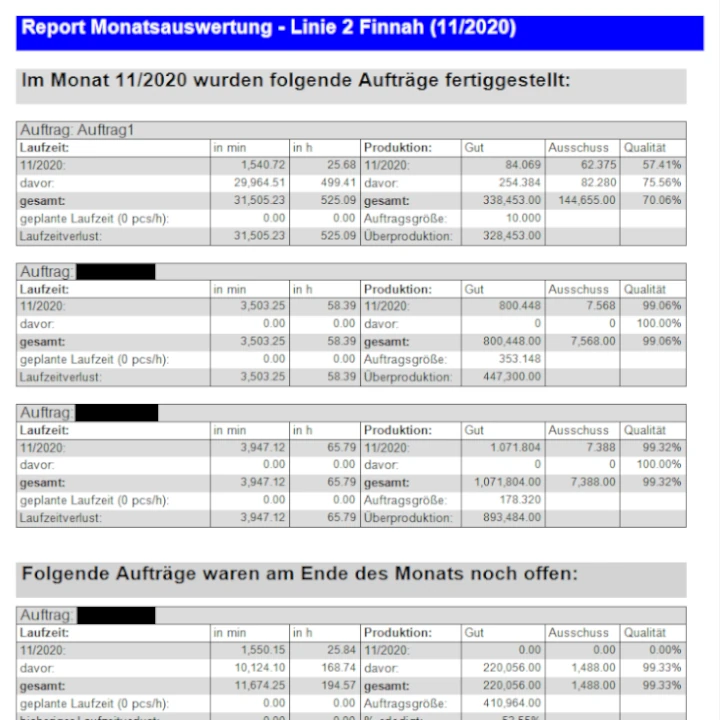
Create monthly reports on all completed and open orders.
Visual display, barcode and custom design
Have the data of your production line clearly displayed directly on site!
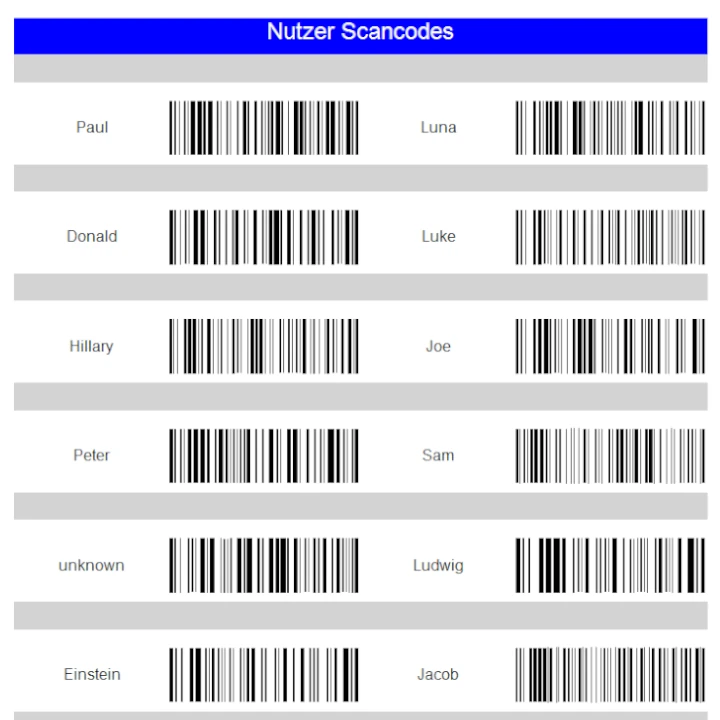
Create scancodes for easy use by your staff.

Do you have other needs? Of course we can also add your custom report type to our tools.
Interfaces of the OEE.Box
Database
Each OEE.Box has its own small mySQL database. The structure of the database is open. You can process the collected data externally with any tools. For example, business intelligence tools such as QlikView can be used for further analysis and linking with other data sources.
Web interface
The OEE.Box also has a web interface. This allows you to access the OEE.Box from any location. Important master data and current key figures can be queried, displayed as a diagram or exported to Excel.
Excel
The OEE.Box offers an Excel interface. Using predefined queries, you can load data from the OEE.Box directly into Excel and process it further.
JSON
Using the JSON interface, database queries can be output via the web server in JSON format. Thus, e.g. hall monitors can be realized.
Contact Us
Request your free quote:
info@clearsystems.de
Phone: +49 9197 2353235