The first launch
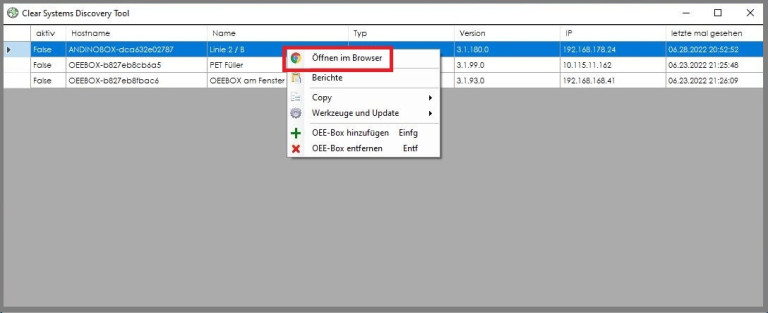
As soon as you have connected your OEE box to the power supply and network, it starts up automatically. Start the OEE Discover Tool on your PC. It is important that the OEE box is in the same network as the Discover Tool. After a few seconds, the OEE box appears in the discovery tool. With a right click you can now open the website in the browser. After login you will see the live display.
Live-Dashboard
A very large amount of data accumulates in production and manufacturing. It is important not only to record and collect the data, but also to continuously evaluate and work with them. Often the necessary know-how or the right software is missing. That's why Clear Systems developed a KPI dashboard. This dashboard gives a simple and quick overview of the production key figures. Individual key figures can be selected and examined for detailed parameters.
In order to make the evaluation of the key figures as easily accessible as possible, it is possible to connect the dashboard to a hall monitor. In this way, every employee can find out about the production data in real time. The dashboard effectively and easily supports the monitoring of key figures. In this way, the OEE.Box enables production to be easily optimized in terms of quality, resources, time and costs, and to make better, data-driven business decisions.
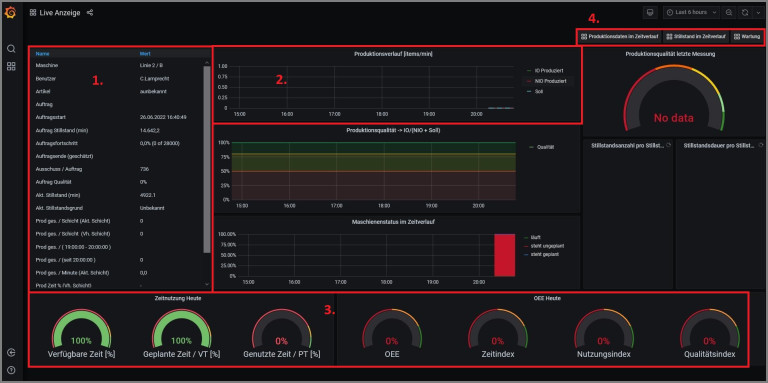
The live display consists of several areas:
- The current machine information
- The current course of time
- The time usage of the current shift
- Forwarding for evaluation
Evaluation
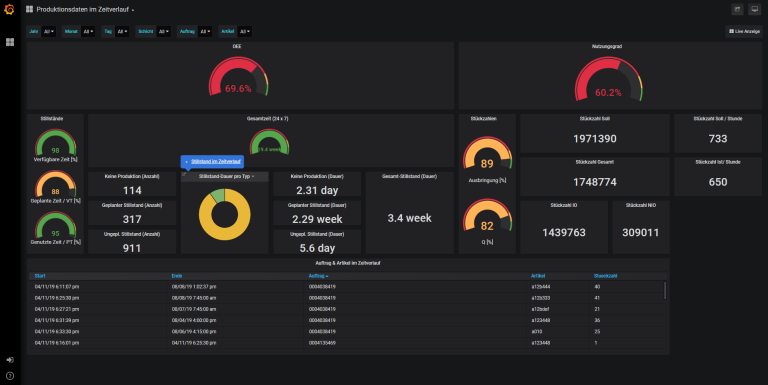
In the evaluation, you can specify exactly which data you want to analyze. The display is adjusted accordingly. By clicking on downtime over time, as soon as you have made all the settings, you can call up a downtime overview:

Custom reports
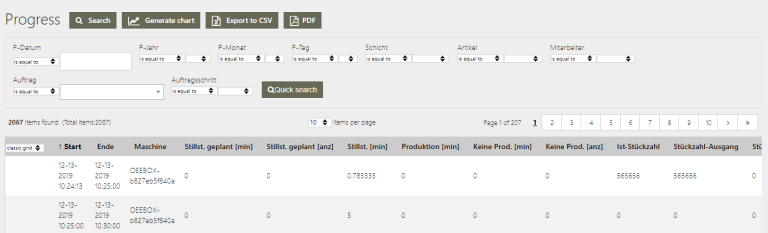
The OEE-Box has the ability to create your custom reports on downtimes and orders. To do this, first call up the live display and then select the topic from which you want to make a report on the left-hand side. You can now use the bar above the table to select the desired data and download your report. You can also display charts with your specific selection.
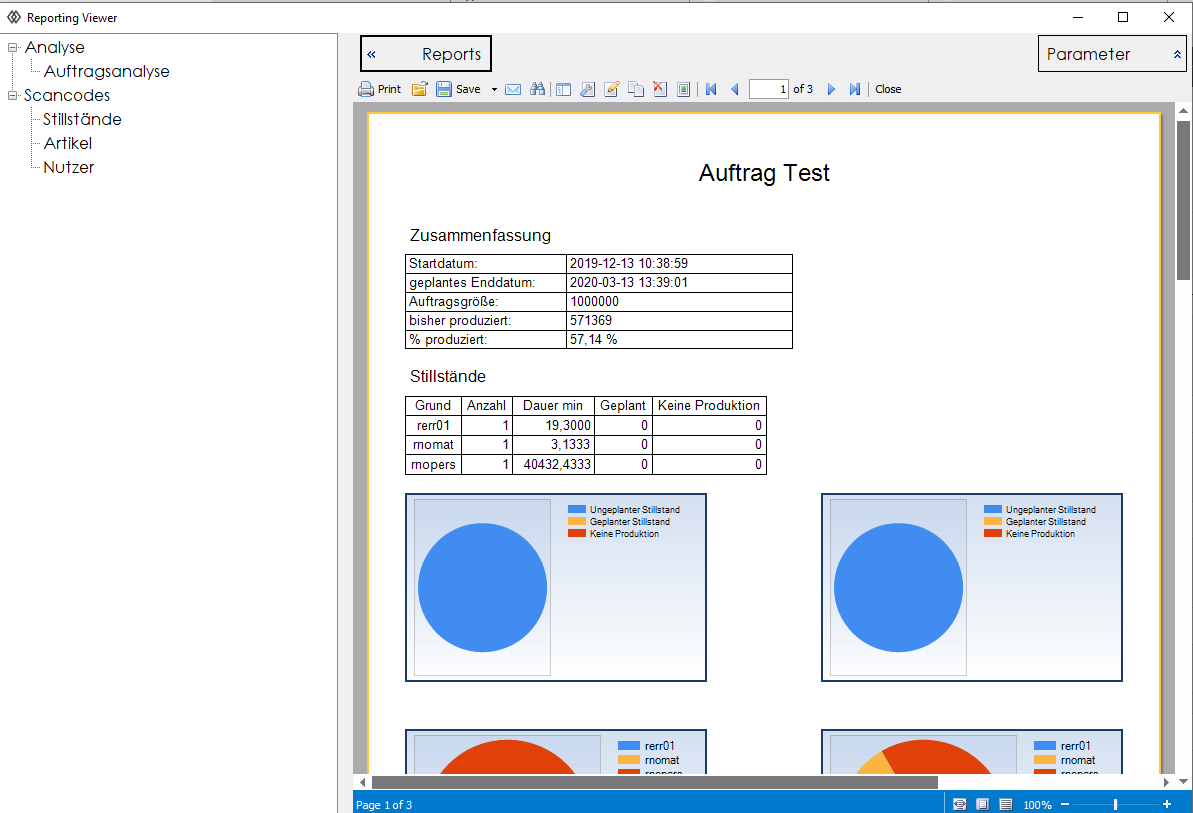
PDF-Reports
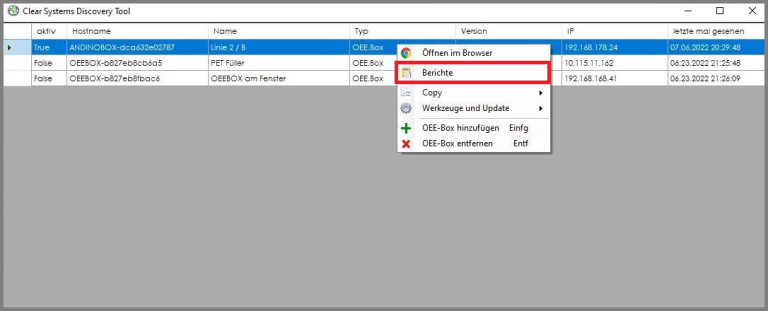
The PDF reports are also started via the Discover Tool. Select the OEE box for your reports and right-click to start the reporting tool. In the Report Tool, double-click on the report. select the parameters and click on show report.