
Data can be read directly from the OEE.Box into Excel. You can then process this data further. Each OEE.Box contains a series of queries that can be called up using an add-in. You only need to install this add-in once.
Below you will find instructions on how to implement this add-in and help with the following questions:
- Which add-in do I have to download?
- How do I install the add-in in Excel ?
- How do I evaluate my data with it?
1. Which add-in do I need to download?
Before you implement the add-in in Excel, you should first check whether you have a 32-bit or 64-bit version of the software.
You can do this as follows:
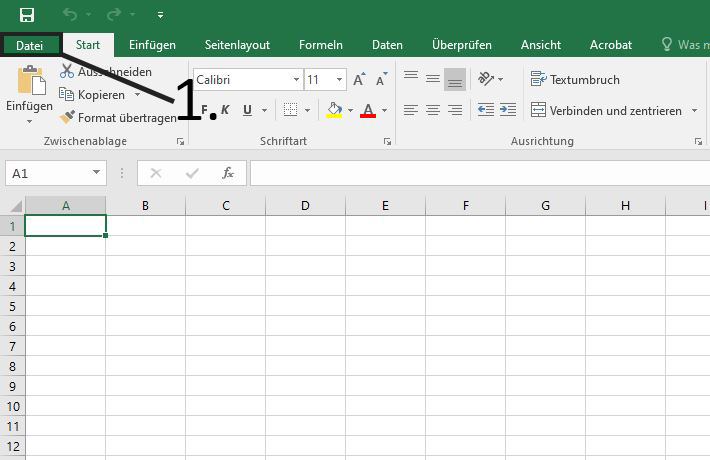
- First click on the navigation point "File"
- Under the item "Account" you will find the button "Info about Excel" under the product information.

- After clicking this button, a window will open where you can look up the bit version of your Excel software.

2. How do I install the add-in in Excel?
Now that you know the version of your Excel software, you can now install the appropriate add-in. You can easily download it here.
Once you have downloaded the add-in follow these steps:
- Open an empty workbook and click on the navigation point File

- Then click Options

- Now click on "Add-Ins" and then on Go...
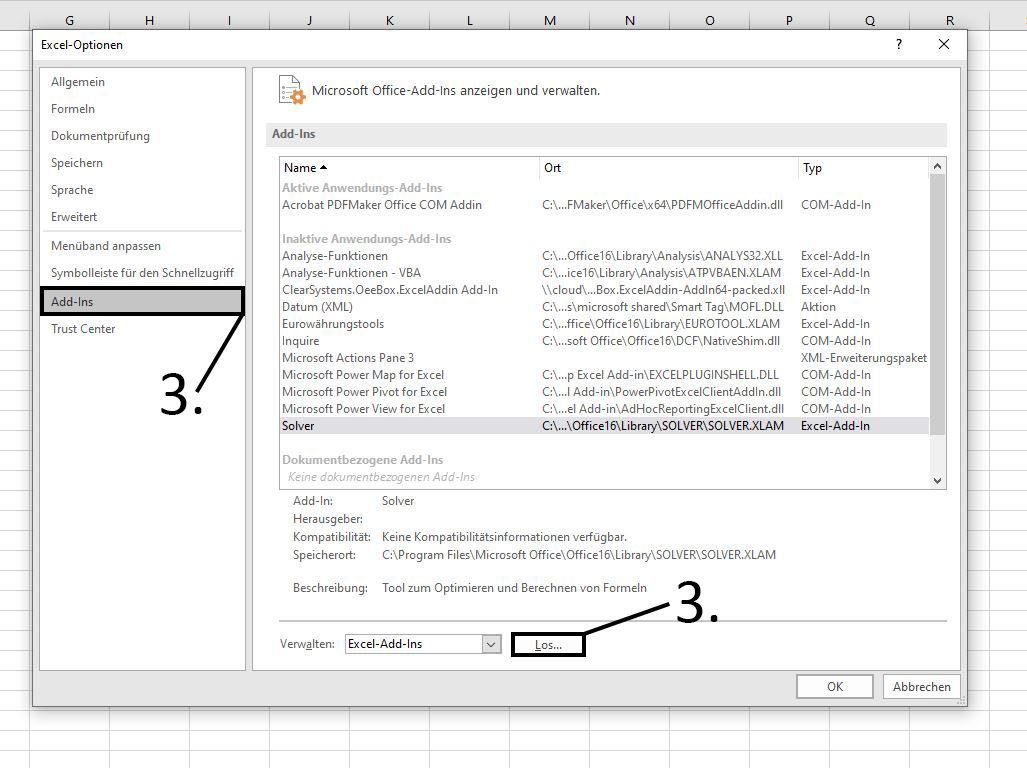
- Now Excel will present you with a list of all available add-ins. Click Browse... and select the downloaded file.

- Then check the add-in you just added and click OK

Now the add-in is installed and ready to use. In the following section we will explain how you can now evaluate data and what display options you have.
How do I evaluate my data with the add-in?
-
First open the discovery tool to find your OEE.Box.
-
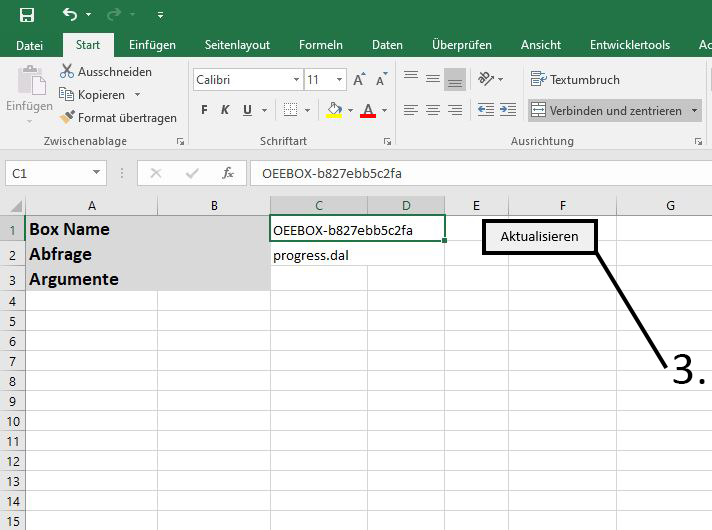
From the Discovery Tool, copy the "host name" of the OEE.Box from which you want to display the data and now open the Excel workbook from the add-in folder.

- After inserting the box name and selecting a query, you can now click the Refresh button on the workbook.
- Now you get a table in which you can read out all data of the selected query. In order to have the data displayed in a comprehensible manner, you can now click on the Pivot folder at the bottom left.

- If you now click on the area marked green in the image, you will see the fields of the query method on the right (marked red here), which you can display according to the principle of a "pivot table".

- If the pivot tables are too long and confusing for you or you prefer the graphical representation of your data, you can do that very easily. Mark the area that contains the relevant data for you and click on the "Insert" tab. Now you can see the various options for graphical representation in the middle below the navigation bar (marked green here).
